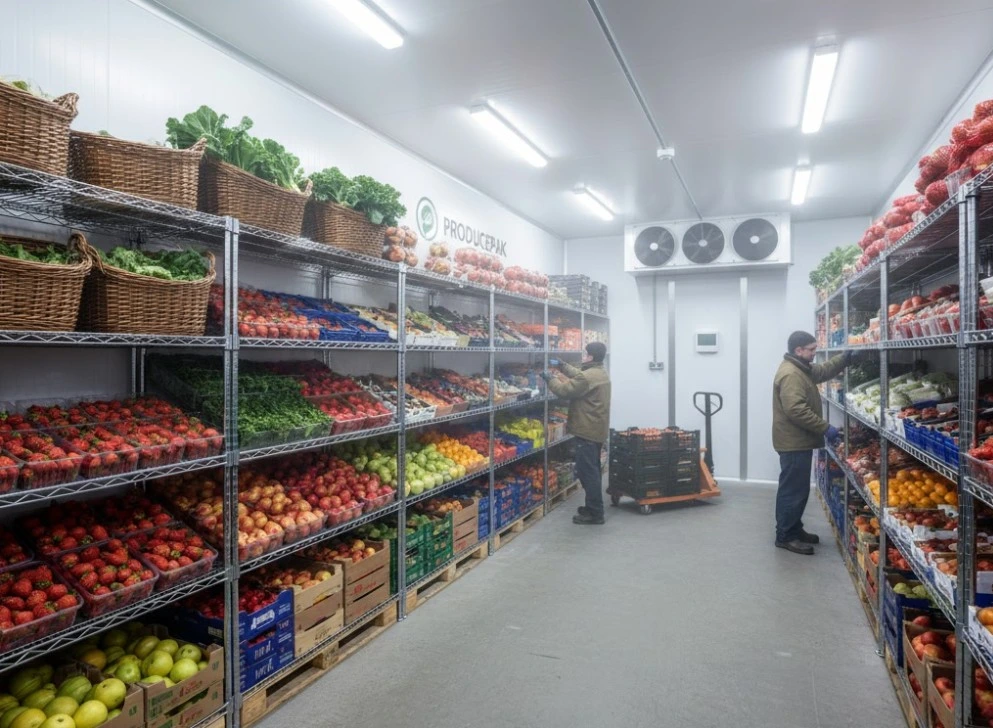
Microsoft BI for fresh produce analysis: Instant access to all your fresh produce data with Microsoft B.I. Online.
Producepak with Microsoft Power BI Online provides a complete operational intelligence framework tailored for the fresh produce industry. Fresh produce enterprises deal with high perishability, variable catch-weights, regulatory compliance constraints, and rapid margin fluctuations. By feeding real-time transactional data directly into Power BI Online, Producepak converts complex operational logs—covering receiving, quality control, inventory turnover, repack yields, picking, and shipping—into financial and executive metrics.
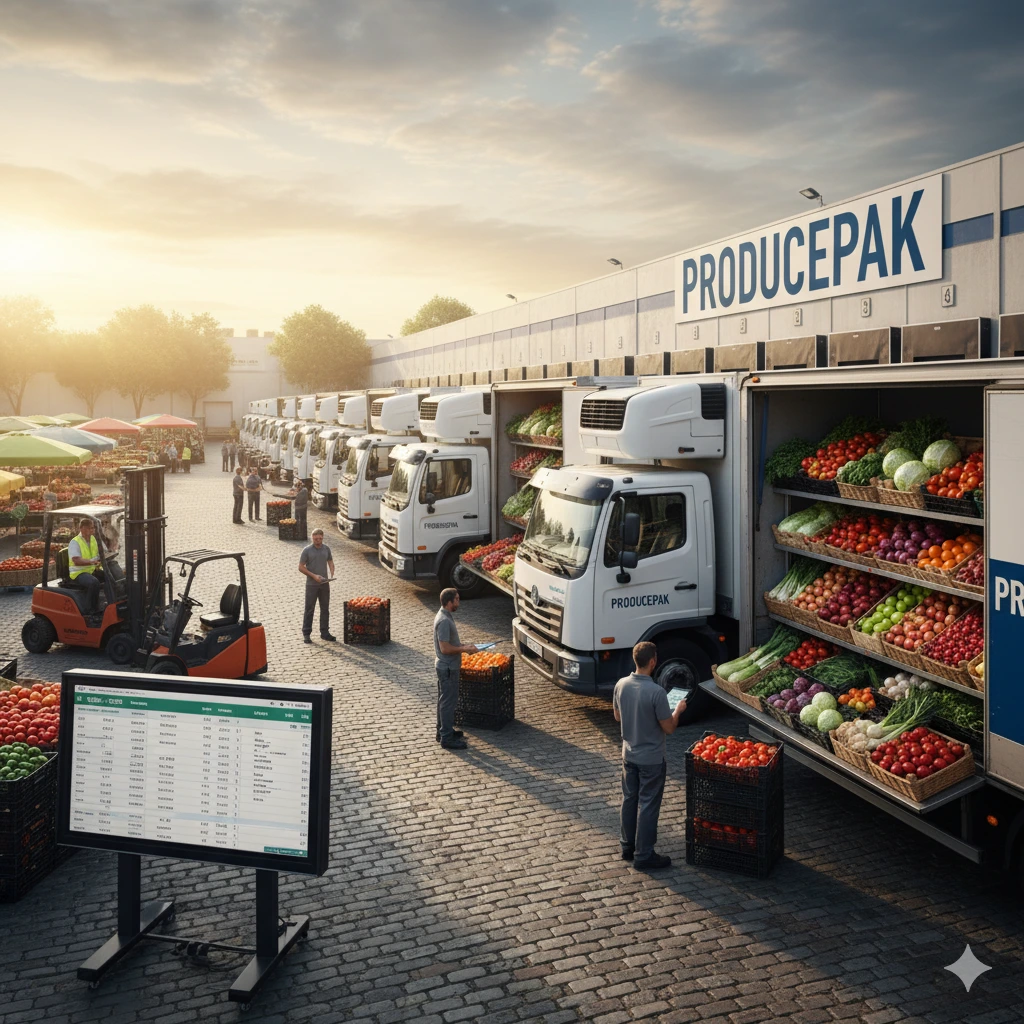
Producepak & Microsoft BI provide Direct Operational Data Pipeline
1. Direct Operational Data Pipeline
Producepak maintains continuous data synchronization with Power BI Online via automated REST APIs and direct cloud dataset streaming. This eliminates manual export/import steps, spreadsheet dependency, and data lag. PRODUCEPAK ENGINE
├── Receiving & Quality Control (QC)
├── FEFO Inventory & Catch-Weight
├── Packing Lines & Repack Yields
└── Picking, Order Entry & Shipping
│
Automated Push API
│
▼
POWER BI ONLINE CLOUD
├── Real-Time Executive Dashboards
├── Financial Margin & Yield Analysis
├── FSMA 204 Traceability Metrics
└── Supplier Quality & Defect Matrix
2. Real-Time Yield Loss and Repack Profitability Analysis
Fresh produce packing and repacking involve significant raw material weight loss through trimming, grading defects, and culling. Producepak tracks exact input kilograms against output finished goods. Exact Margin Calculation: Power BI Online processes Producepak's raw-to-finished conversion data to calculate precise lot-level margin realization in real time. Waste Quantification: Immediate visualization of scrap percentages per grading run allows production managers to hold growers or shift operators accountable for low pack-out yields. Labor Efficiency Correlation: Direct tracking of throughput per packing line combined with output volume metrics isolates line performance variances across shifts. Raw Bulk Intake (10,000 kg) ──► Producepak Packing Line ──► 8,800 kg Retail Units (Packed)
└──► 1,200 kg Cull/Waste (12% Loss)
│
Pushed to Power BI Online
│
▼
Real-Time COGS & Margin Adjusted
3. Live Catch-Weight and Inventory Valuation Tracking Static case-count tracking causes financial discrepancies because natural weight loss occurs daily in temperature-controlled rooms. Producepak logs exact weights at every scan point. Dynamic Weight Loss Accounting: Power BI Online monitors inventory decay rates across storage locations, alerting managers to weight loss exceeding threshold limits (e.g., >1.5% mass reduction in cold storage).True COGS Visibility: Financial controllers view net mass valuations rather than estimated case averages, preventing month-end ledger write-downs.
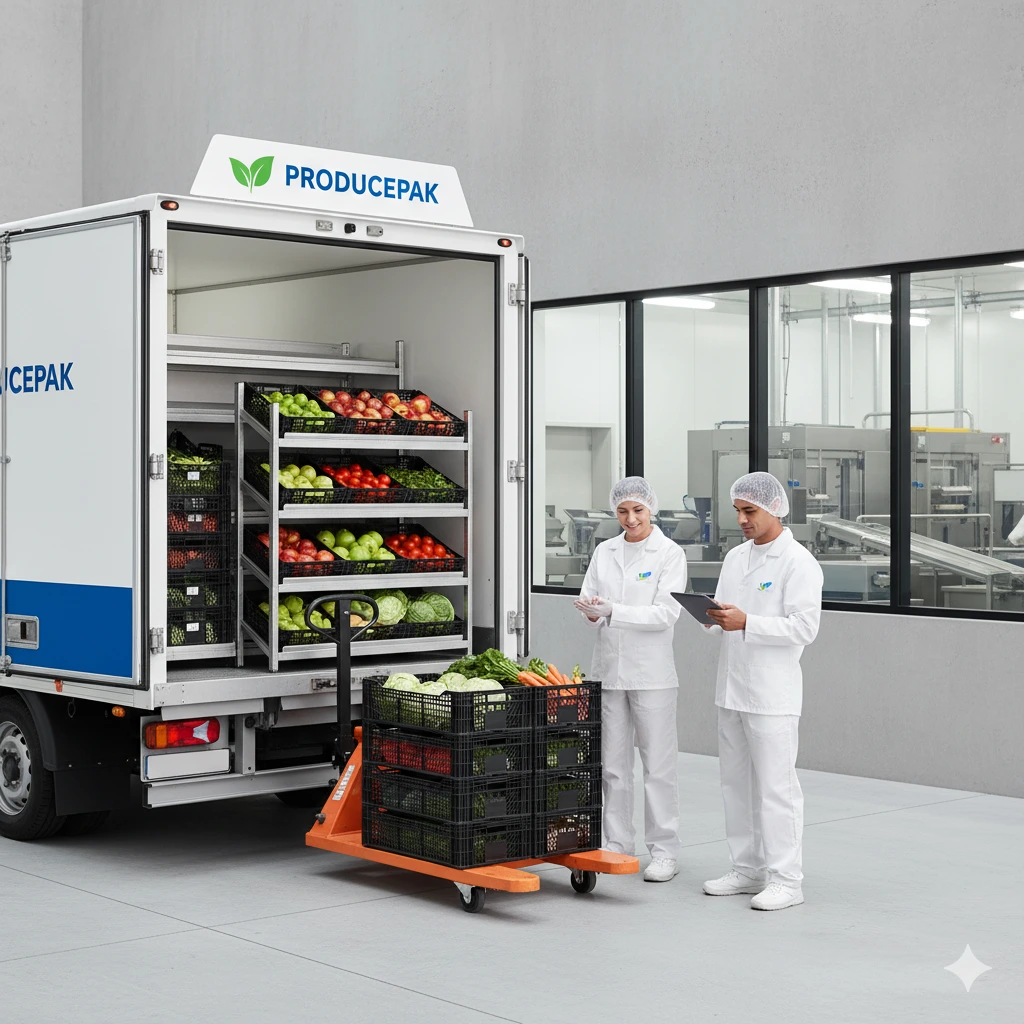
Automatic fleet planning for sourcing fresh produce
4. Automated First-Expired, First-Out (FEFO) Optimization
Product spoilage directly impacts the bottom line. Producepak enforces FEFO picking rules on the floor and pushes real-time aging profiles to Power BI Online.
Spoilage Mitigation: Color-coded inventory dashboards highlight expiring lots, enabling sales teams to discount or move vulnerable inventory before write-offs occur.
Customer-Specific Shelf-Life Matching: Power BI displays customer delivery constraints alongside available inventory, preventing rejections at destination distribution centers.
5. Supplier Quality Scoring and Defect Metrics
Receiving low-quality raw produce leads to increased labor costs, customer claims, and reduced sellable volume. Producepak records Brix levels, pressure tests, core temperatures, and visual defect percentages upon arrival.
Vendor Performance Index: Power BI Online aggregates intake QC data into supplier scorecards.
Claim Automation: When incoming defect rates exceed contract limits (e.g., >5% internal rot), Power BI dashboards cross-reference shipment values to calculate automatic credit request totals.